Overview
Imagine automatically building dynamic multi-media, logic driven content (e.g., charts, graphs, conditional text and formatting, etc.) based entirely on a Subject's OWN data! Learn more and see examples here.
Common Uses
| Clinical Trials | Patient Registries | Subject Portal |
|---|
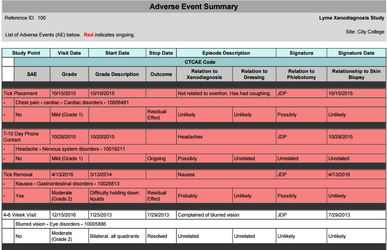
- Serious Adverse Event and Adverse Event reporting
- Other event reports (e.g., protocol violation, randomization / enrollment, etc.)
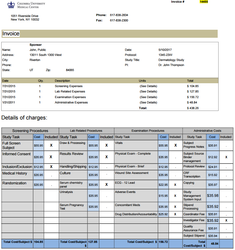
- Invoice creation and reconciliation
| - Automated clinic notes
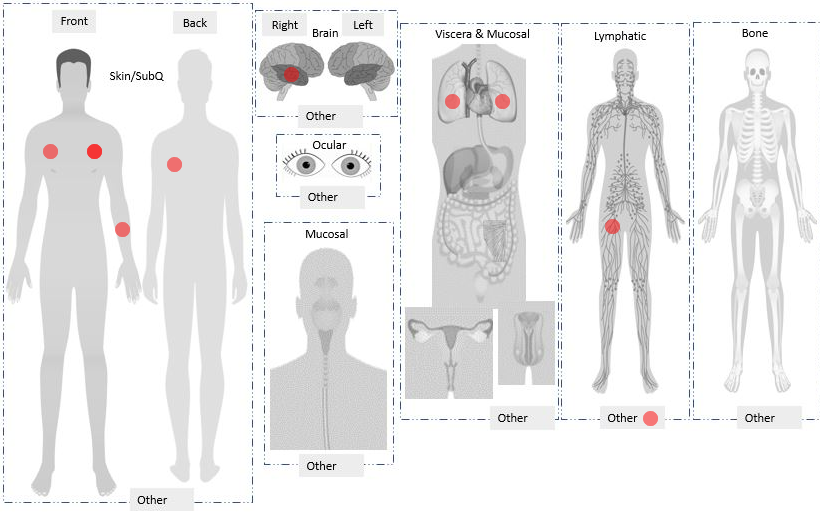
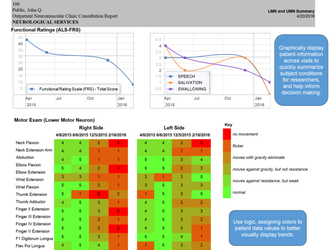
- Data visualization (e.g., charts, graphs, overlay images [i.e., plot tumor locations; see article here])
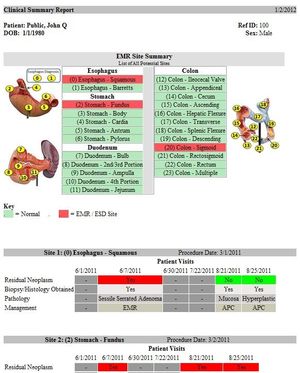
- Case conference notes (e.g., across specialties summaries [i.e., see Clinical Report design article here])
| - Dynamic newsletter based on preferences, milestones, etc.
- Outcome goals monitoring and points achievement
- Delivery of targeted educational materials (e.g., symptom triggered training materials, such as videos - website links - pods casts - etc.)
|
...
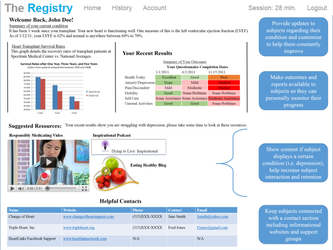
| Reports for Subjects | Reports for Investigators |
|---|
|  |
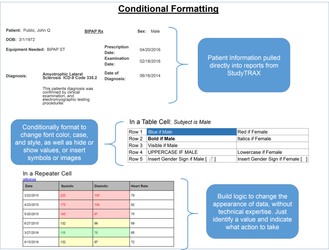
| Conditional Formatting | Adverse Event |
|---|
| |
| Visit Summary | Automated Image Overlay (e.g., plot tumor locations) |
|---|
| |
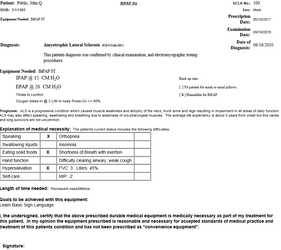
| Invoice | Device Prescription |
|---|
| |
...